

The Payment Economics — Issue 001
The ECB’s payment statistics are probably the most complete public picture of the European payment system. Its latest release, published in July 2026 and covering the second half of 2025, records 83.5 billion non-cash payments for a total value of €117.8 trillion.
Its value goes beyond a reading of volumes. Taken apart, compared over time and set against market trends, this data reveals shifts — sometimes gradual — that end up showing in a company’s operations and economics. That is the exercise we devote this first issue to.
1. Usage and the payment mix
In the second half of 2025, cards accounted for 57% of non-cash payments by count, ahead of credit transfers, direct debits and e-money. By value, the hierarchy inverts almost entirely.
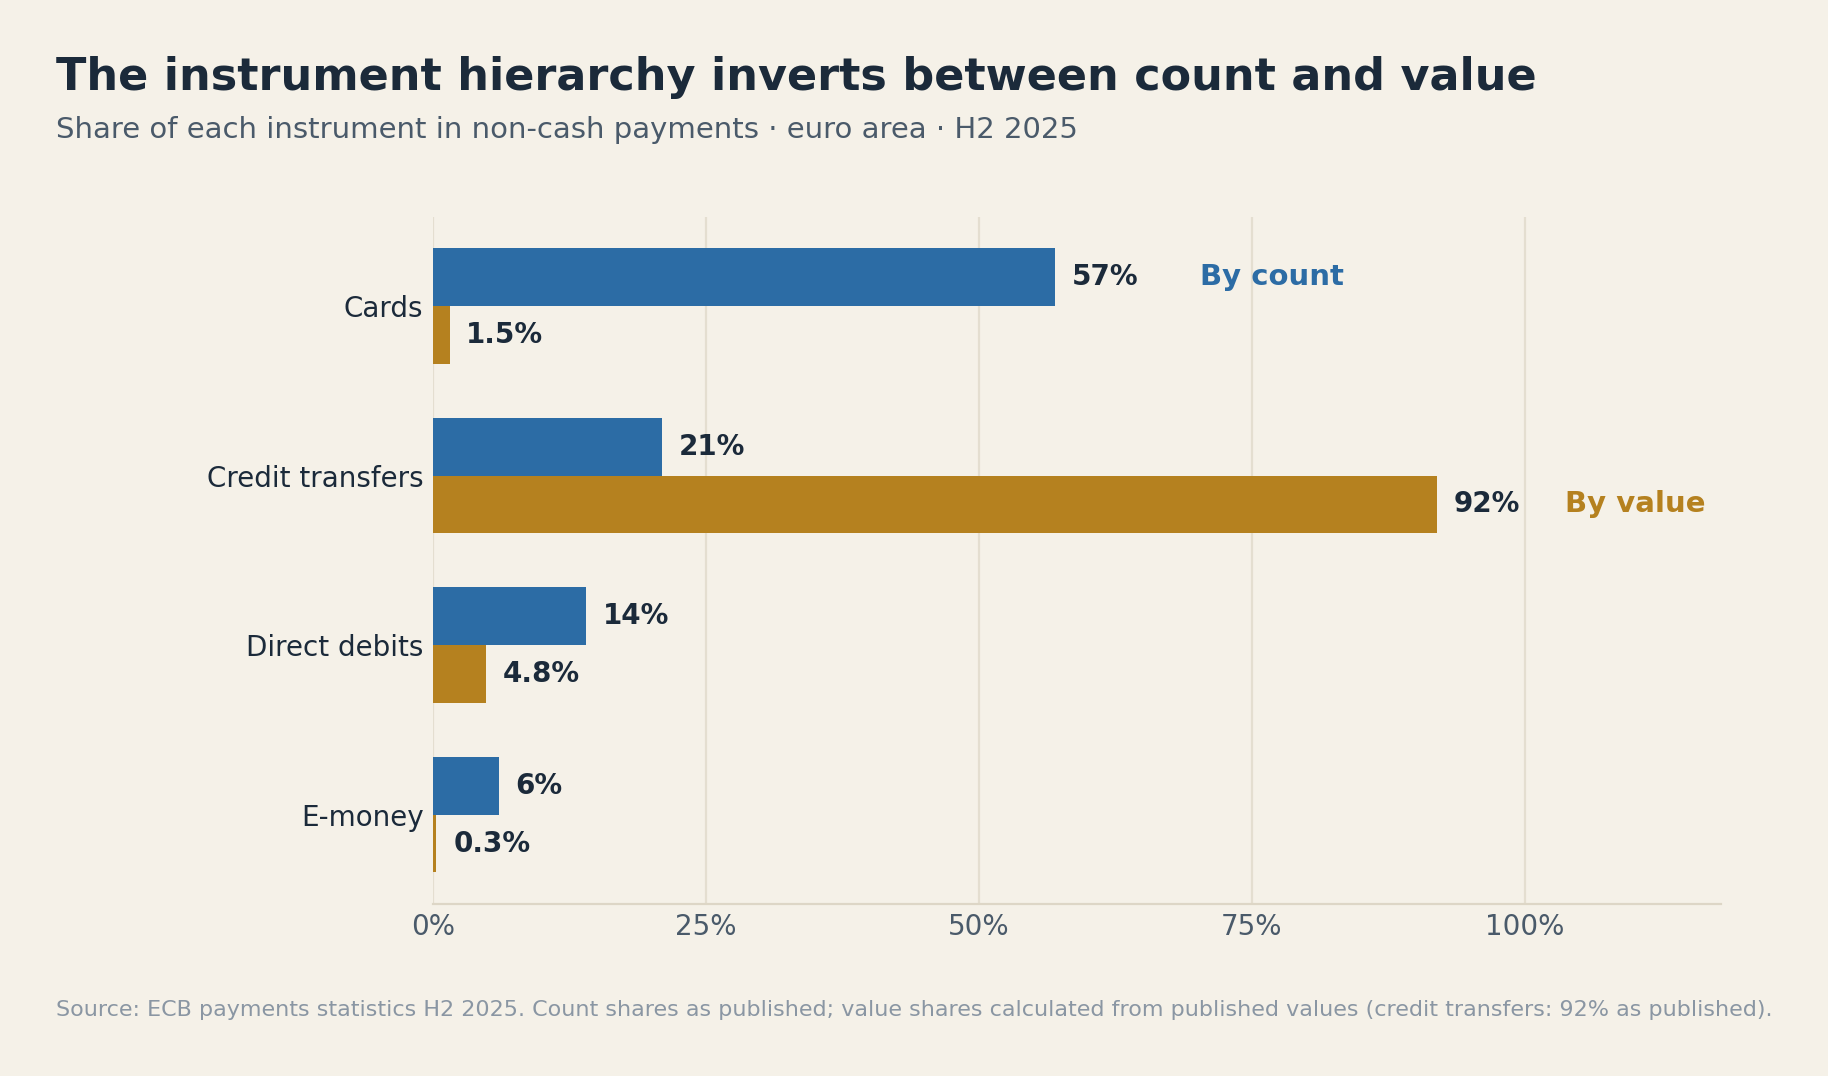
That inversion is not a statistical curiosity. Count and value are two distinct cost bases: value carries ad valorem fees, liquidity, and exposure; count carries most of the per-event processing load and operational work. A model built on GMV alone therefore leaves one of its two drivers implicit.
Four movements emerge from the comparison with earlier releases.
Cards are still growing, but decelerating. 47.8 billion transactions, up 7.9% year on year. Growth remains strong, but it has slowed continuously for eighteen months: +11.3% in H2 2024, +9.6% in H1 2025, +7.9% in H2. Over the same period, credit transfer growth by count stayed between 6.5% and 7.7%.
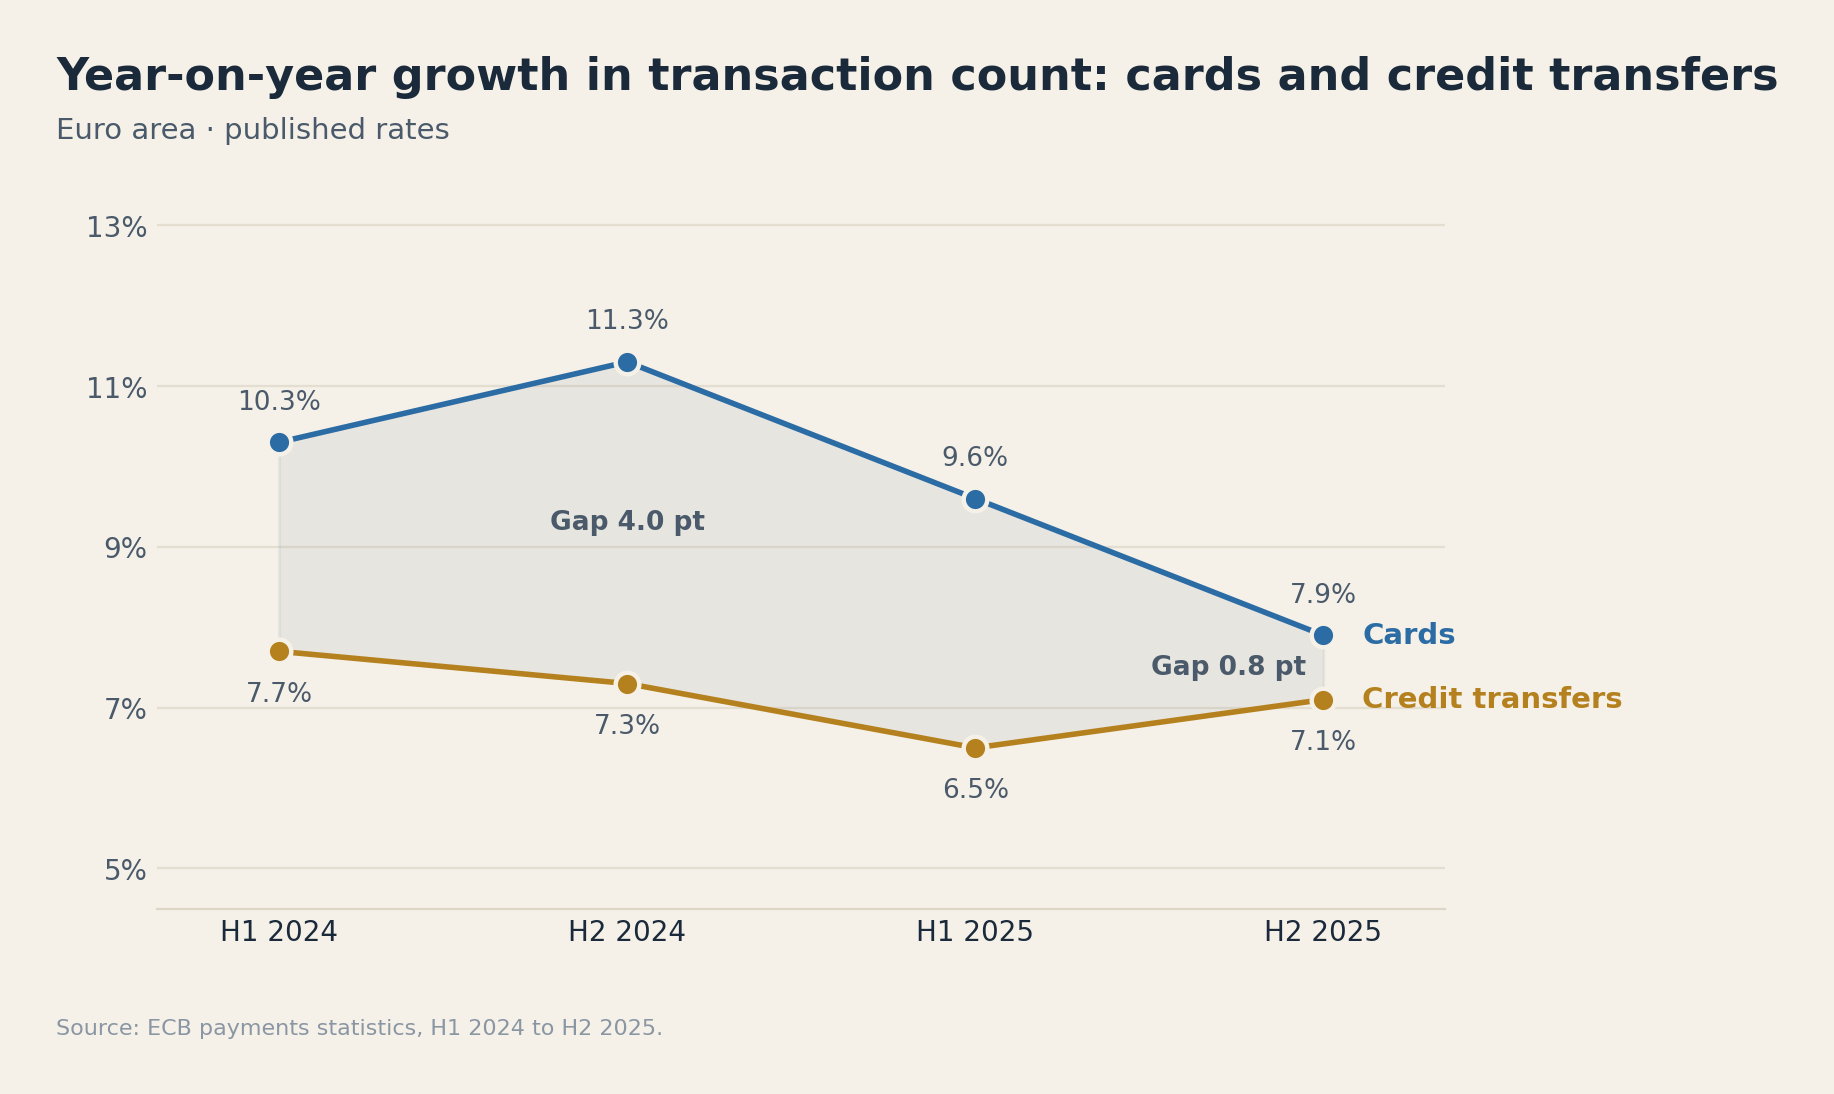
The growth gap between the two instruments therefore moves from 4.0 points in H2 2024 to 0.8 points a year later. The decomposition matters as much as the result: cards lose 3.4 points of growth over the period, credit transfers 0.2 points. The gap closed because cards slowed, not because transfers accelerated. One half-year does not constitute a reversal, and the January 2027 release will be the first useful test.
The same release adds a usage indicator: within euro-area retail payment systems, instant credit transfers account for 25% of the number and 8% of the value of credit transfers processed. That is not a merchant-acceptance share, but it does establish that instant infrastructure already carries a material number of low-value transfers.
Contactless is no longer a technology being adopted: it is infrastructure. With 32.9 billion transactions (+11.9%), it now represents 85% of in-person card payments by count and 70% by value, against 79% and 62% in H1 2024. At that level, the remaining headroom is only fifteen points.
The terminal estate is growing four times faster than the transactions it processes. Point-of-sale terminals move from 20.7 to 25.7 million, or +24.6%, while in-person card payments grow by 6.6%: the average number of transactions per terminal therefore falls by about 14% year on year. This reading needs handling with care. The ECB notes that multi-acquiring can lead several providers to declare the same terminal, and the growth rate of the estate moves from +7.9% in H2 2024 to +24.0% in H1 2025. The data therefore does not allow real expansion of the estate to be distinguished from a counting effect.
Payment methods are stacking rather than substituting. Between 2024 and 2026, the share of merchants declaring they accept mobile payments moves from 36% to 68%, while card acceptance holds at 88% and cash acceptance rises from 90% to 92%. Set against the fact that 93% of the terminal estate is contactless-enabled, this increase probably reflects better awareness of what the existing terminal already does, more than the adoption of a new instrument.
These movements converge on a single observation: the European payment mix is not simplifying; it is thickening.
2. The trajectory of average tickets
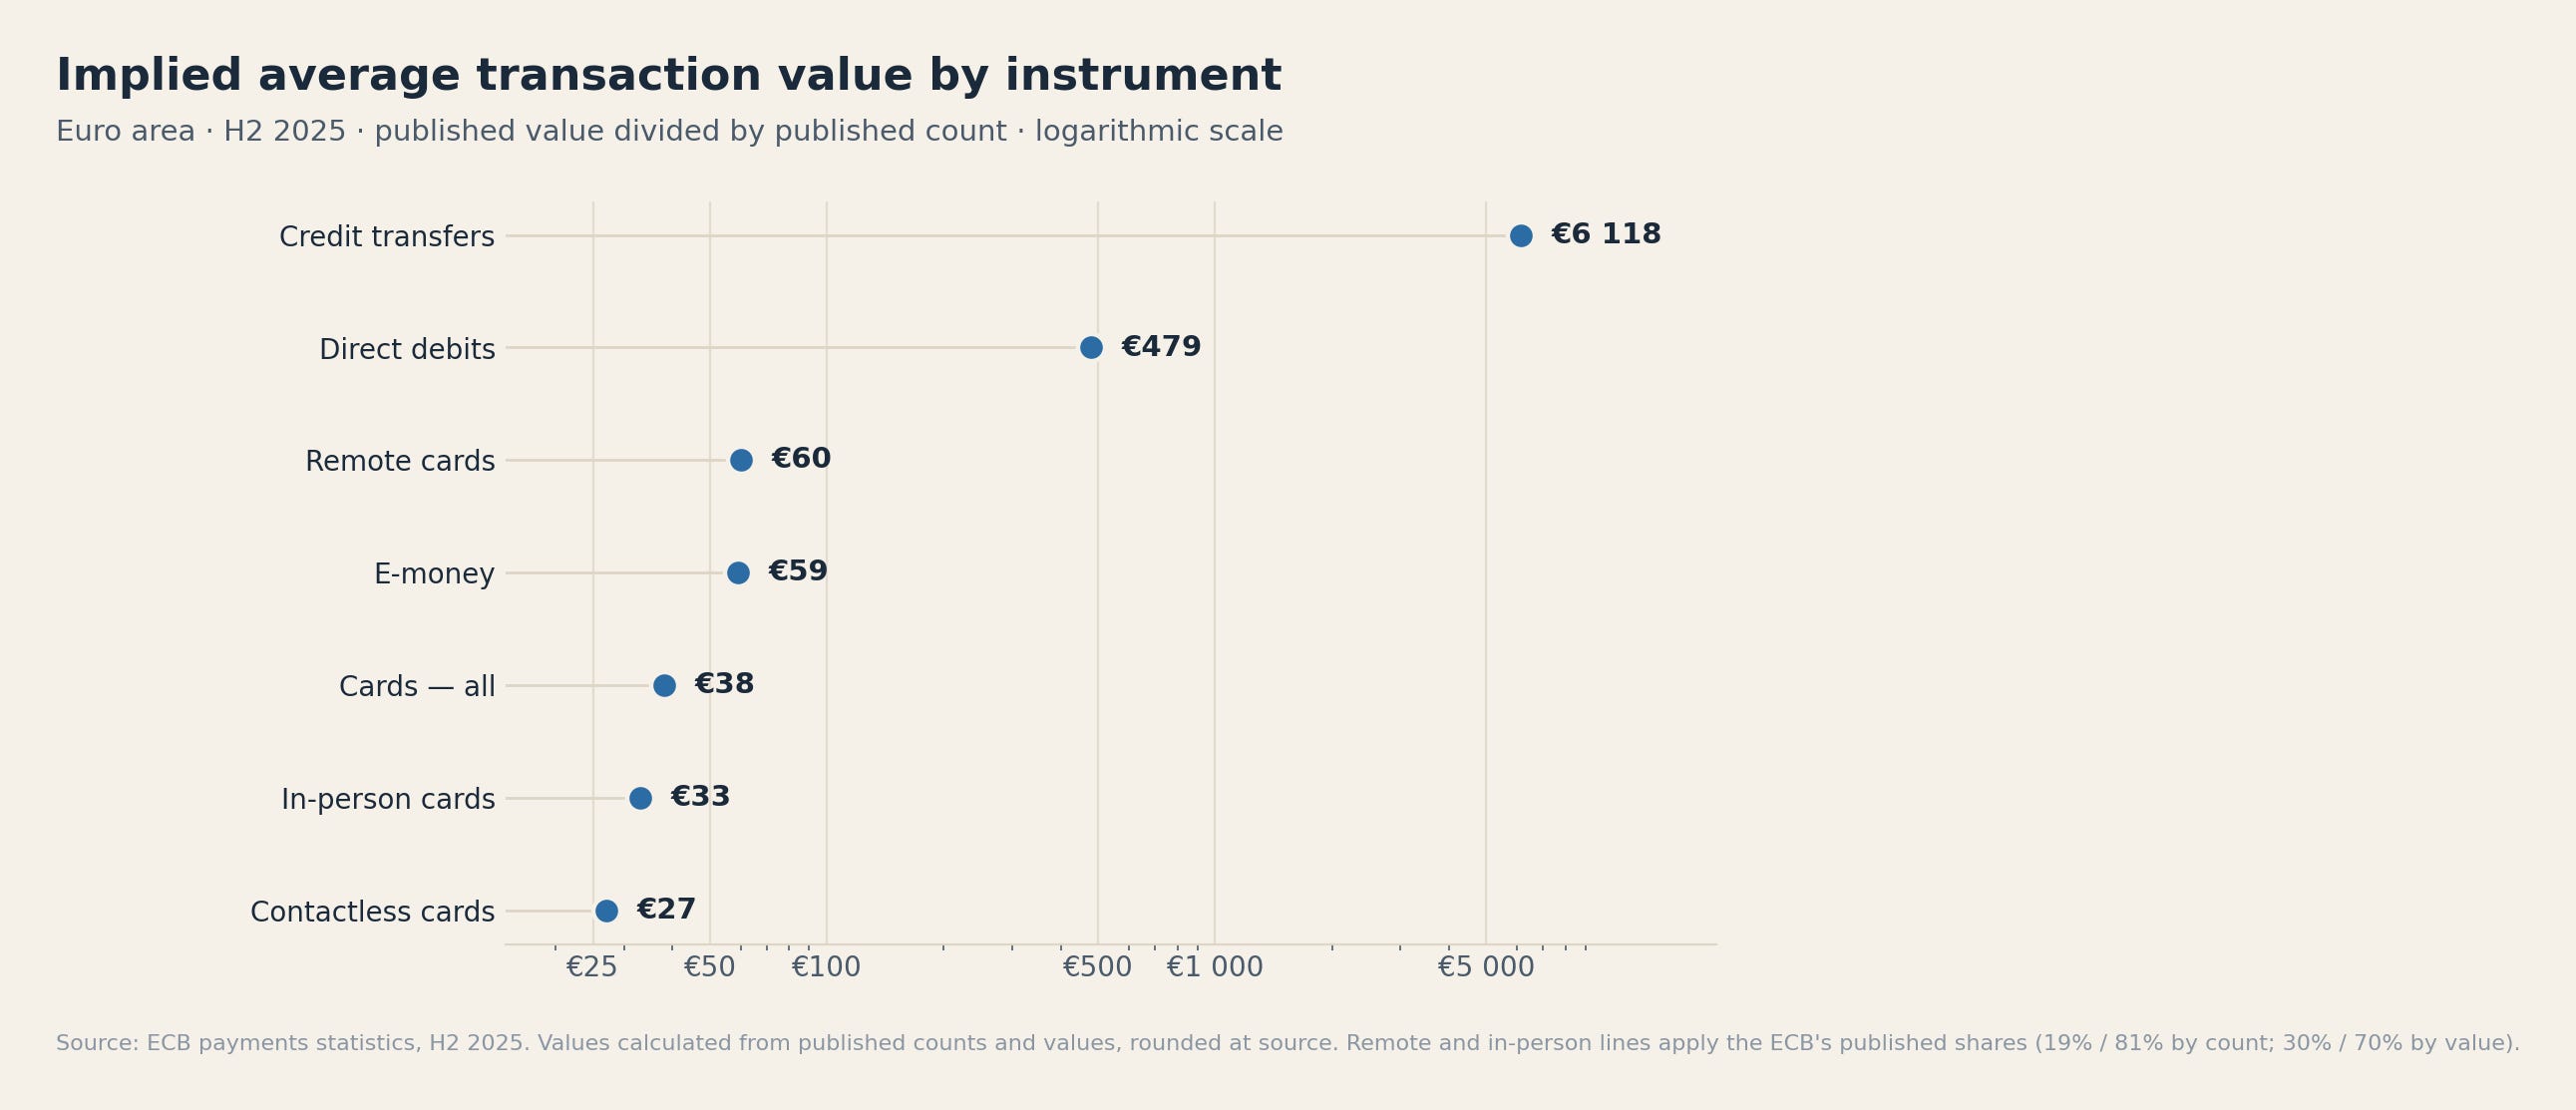
Set against each other, count and value produce implied average tickets separated by two orders of magnitude.
Across each of the last four published half-years, the number of card payments grew faster than their value. The direction has been constant for two years. The amplitude, however, has been divided by three before stabilising around −0.9%.
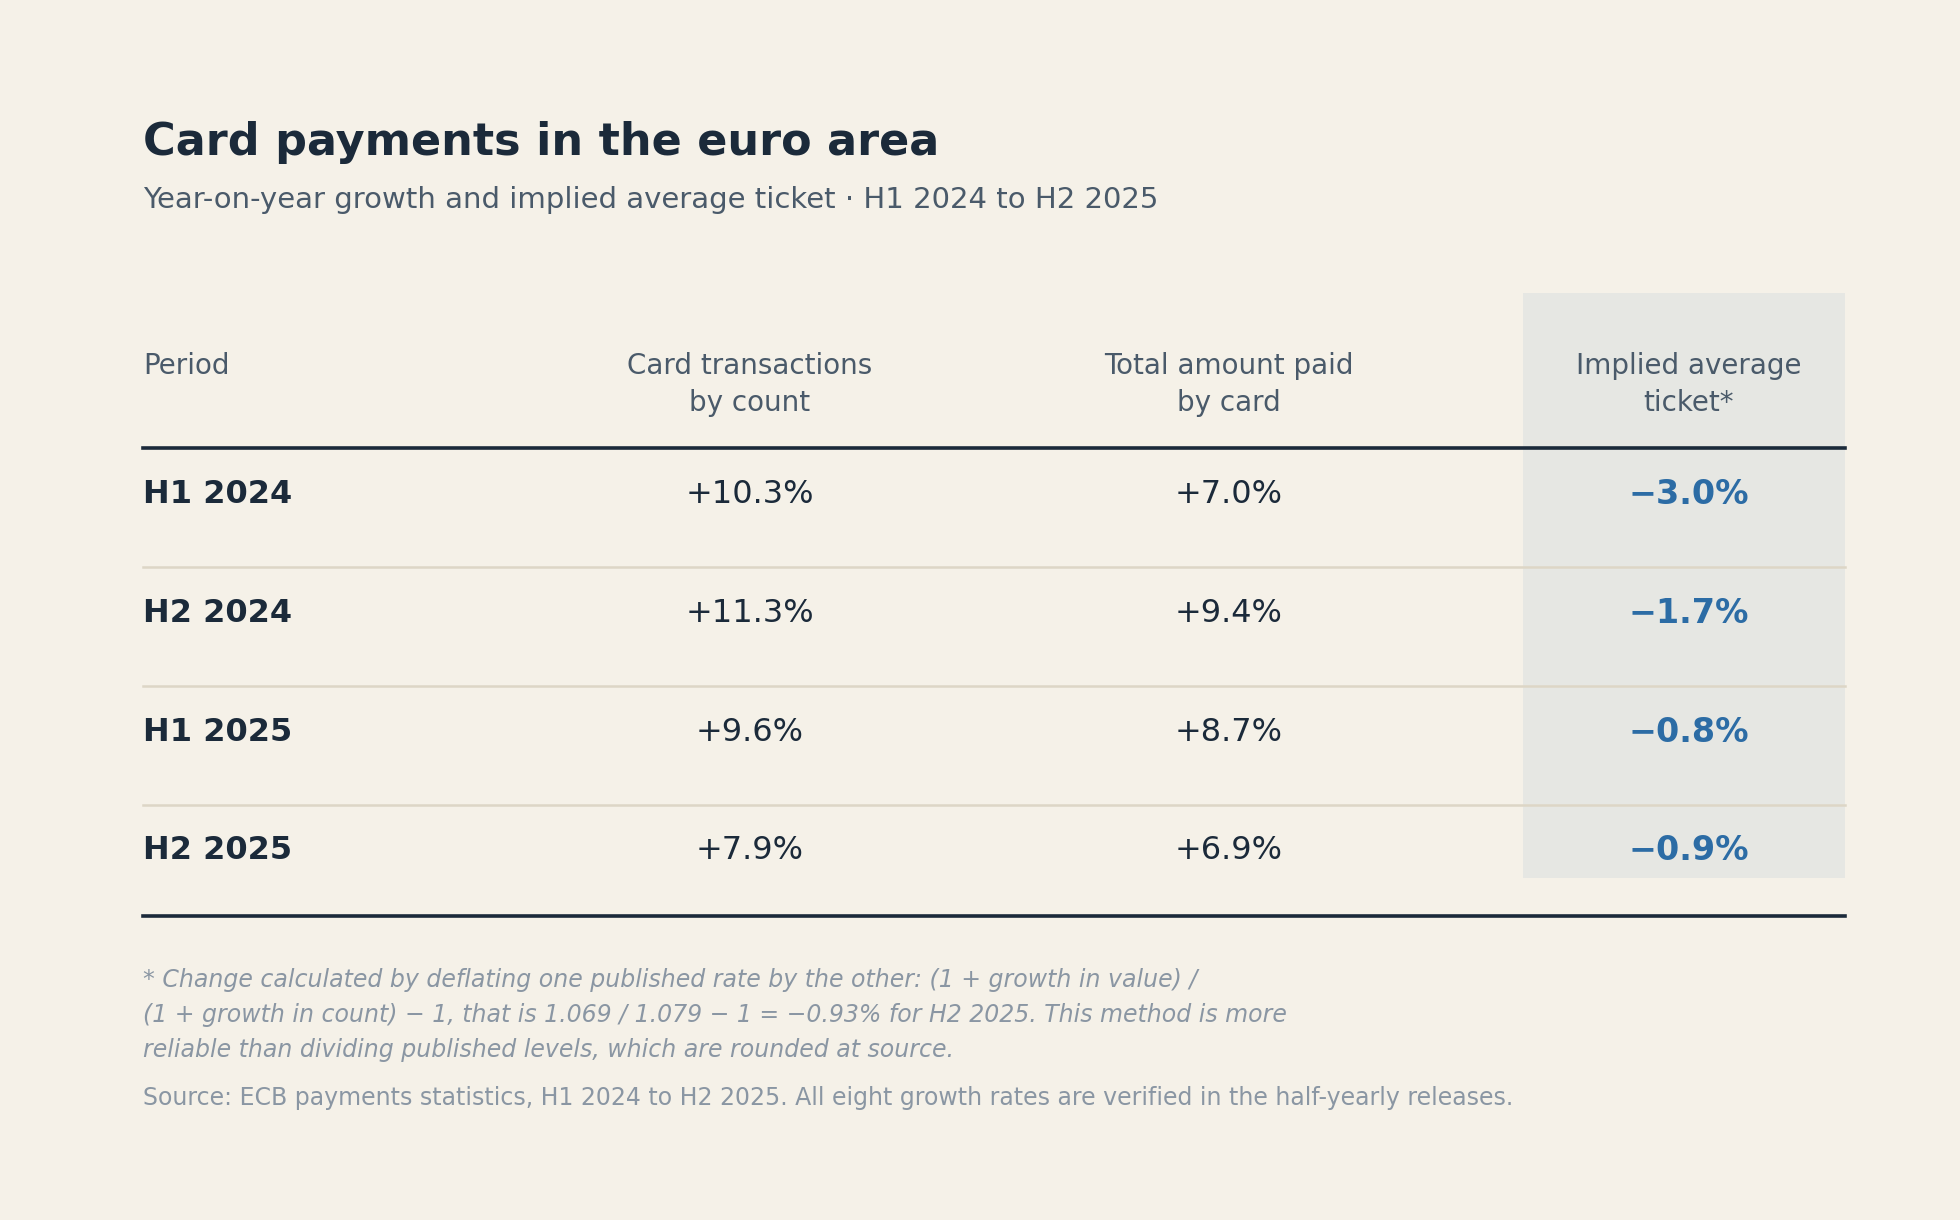
The instinctive reading keeps the constancy and overlooks the deceleration. It should be the other way round. The profile is not that of a structural trend settling in, but that of a transition reaching its end — consistent with contactless already at 85% of in-person payments.
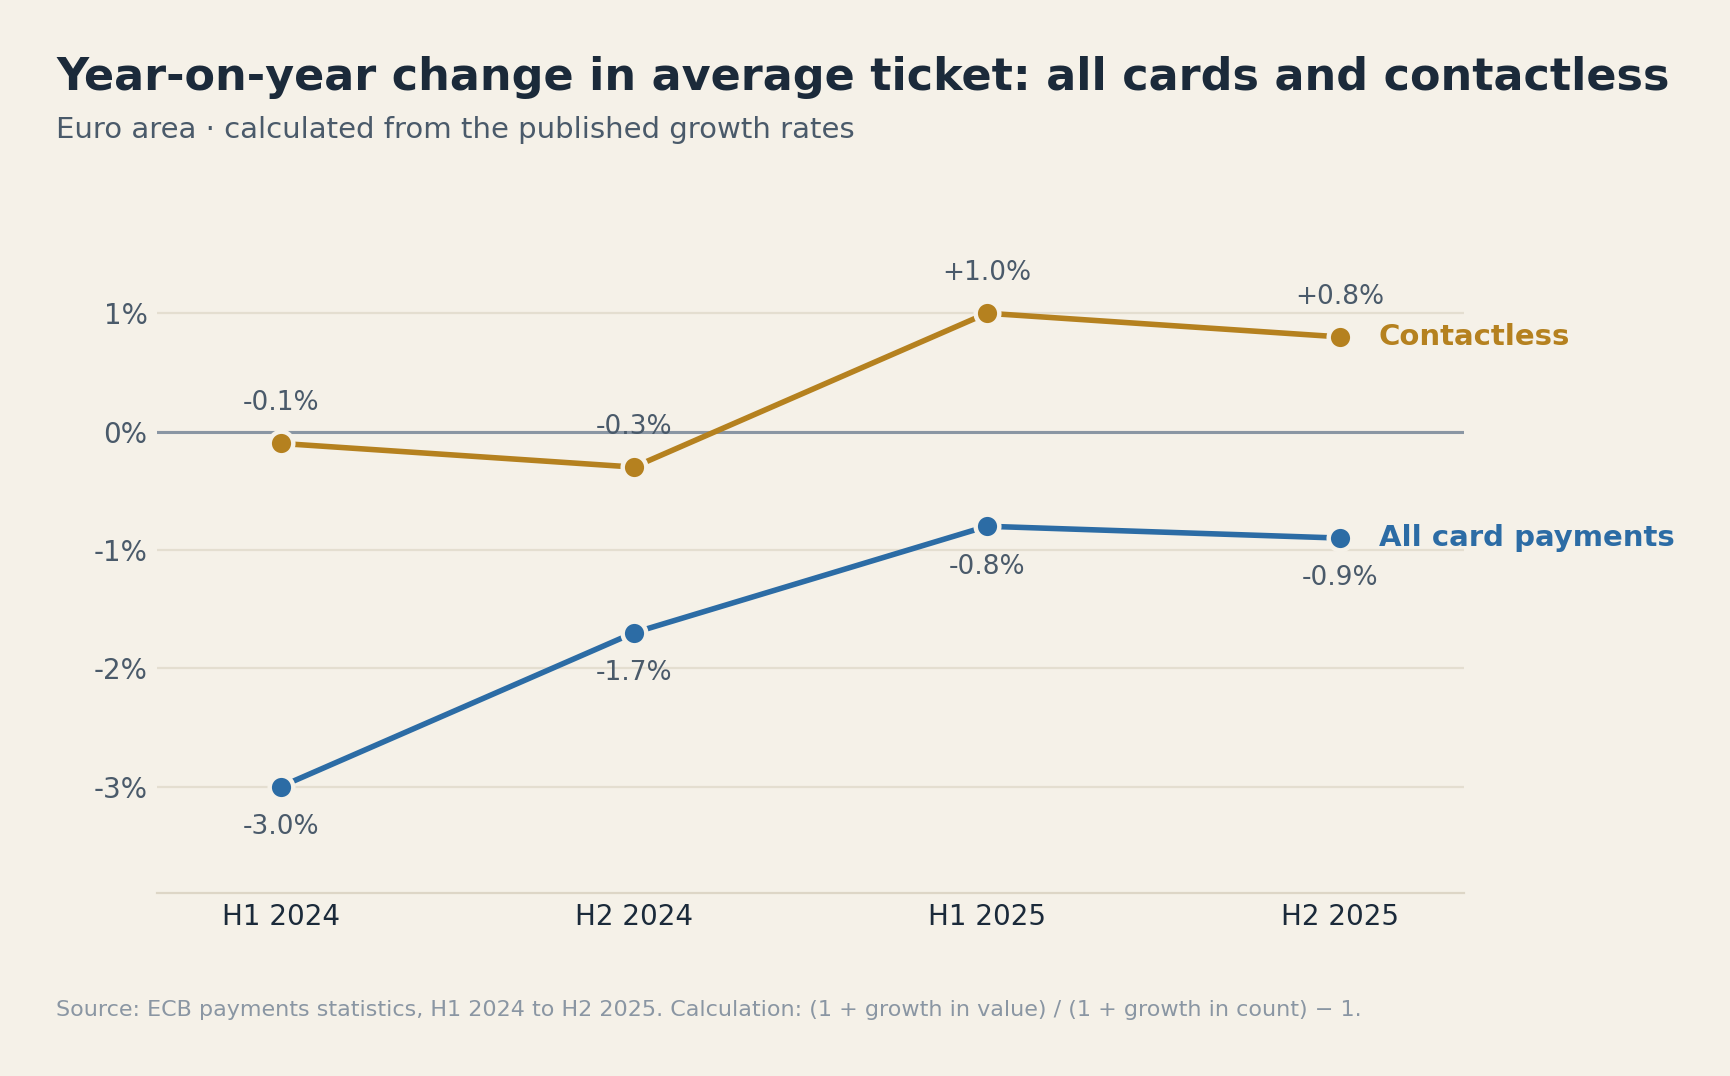
Contactless confirms that reading directly. Having moved small baskets from cash to card, its own ticket goes from −0.1% and −0.3% in 2024 to +1.0% and then +0.8% in 2025. The engine of compression has changed sign, confirming it over two consecutive half-years.
If the decline stops now, the one that has already happened is banked: between H1 2024 and H2 2025, the aggregate card ticket fell by roughly 3% cumulatively. That drift occurred with the contract unchanged. And yet, mechanically, it changed the cost of every euro collected.
3. The unit economics of a transaction
3.1 Why a falling average ticket is a financial subject
Acceptance costs are overwhelmingly managed as a percentage of GMV: 80 basis points, 120 basis points, 1.5% of processed volume. The convention is convenient, and it conceals a structural property of the cost stack.
Some costs vary with the value of the transaction. Others vary with its existence: scheme fees per authorisation and per clearing record, PSP per-transaction fees, gateway, 3DS, tokenisation. A third category — terminal rental, monthly minimums, subscriptions — is fixed per period and follows neither.
The consequence is immediate: when the average ticket falls, the basis-point weight of fixed costs rises, with the contract and the tariffs strictly unchanged. That is a mix effect, not a pricing effect, and the distinction determines who you should be asking.
3.2 The order of magnitude
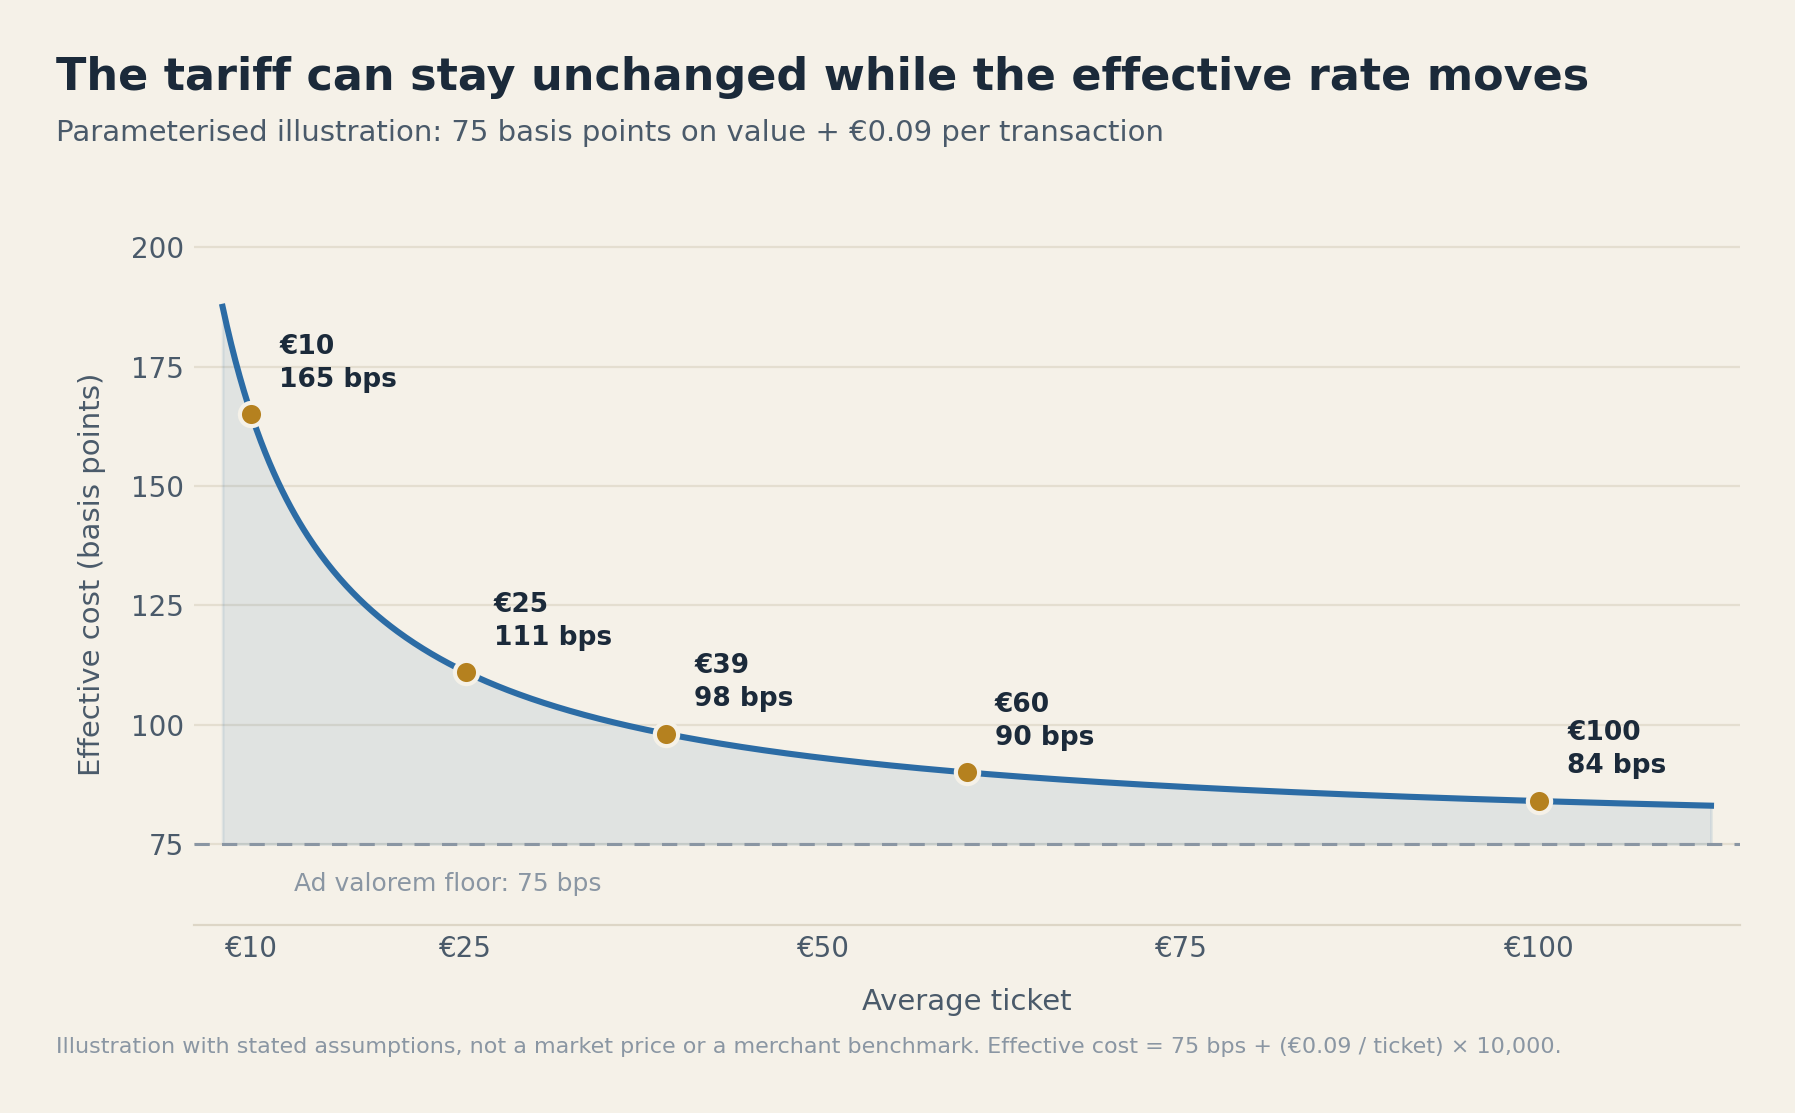
Nine cents are worth 9 basis points on a €100 payment and 90 basis points on a €10 payment. The supplier has raised nothing, the contract is identical, and the unit economics bear no resemblance to one another. On €1 billion of annual volume, one basis point represents €100,000.
3.3 The counter-intuitive consequence
Applied to the euro-area aggregate, the drift is modest: roughly 3% cumulative over two years, which is less than one basis point on the model above. That should be said rather than inflating the effect.
If this deceleration marks the completion of the transition, the stakes move. It is no longer about forecasting the ticket, but about whether the company detects a drift that produces no signal — and whether it turns that into a renegotiation argument.
Since our last pricing agreement, our average ticket has fallen by several percent. Has anyone measured it, and has the contract been reopened?
In almost every case, the answer is no — because nothing produces the alert. The contractual rate has not moved. The invoice carries no new line. Only the effective cost has shifted, and nobody calculates it. This is a retrospective audit problem, not a forecasting problem.
Two qualifications. This mechanism only bites if your schedule includes per-transaction fees: on a purely blended rate, a falling ticket costs your acquirer, not you. And the euro-area aggregate blends every vertical, including high-ticket e-commerce that heavily dilutes the effect. It is a floor, not a forecast: a quick-service restaurant, a transport operator or a gaming operator taking repeated low-value deposits move several times faster, and from a far more sensitive point on the scale above.
3.4 Two costs the public data sees poorly
Acceptance cost itself. The only public European series comes from a study commissioned by the European Commission, which reports the net merchant service charge on debit cards rising from 0.27% in 2018 to 0.44% in 2022 — seventeen basis points. Its authors state that the sample is limited, that it covers twelve countries, and that the level cannot be extrapolated to the EU-27. It is a market signal, not a benchmark.
Fraud, which is a cost. The joint EBA–ECB report published on 15 December 2025 puts payment fraud in the EEA at €3.4bn in 2022, €3.5bn in 2023 and €4.2bn in 2024 — an increase of €602 million, or +17%, over the last year.
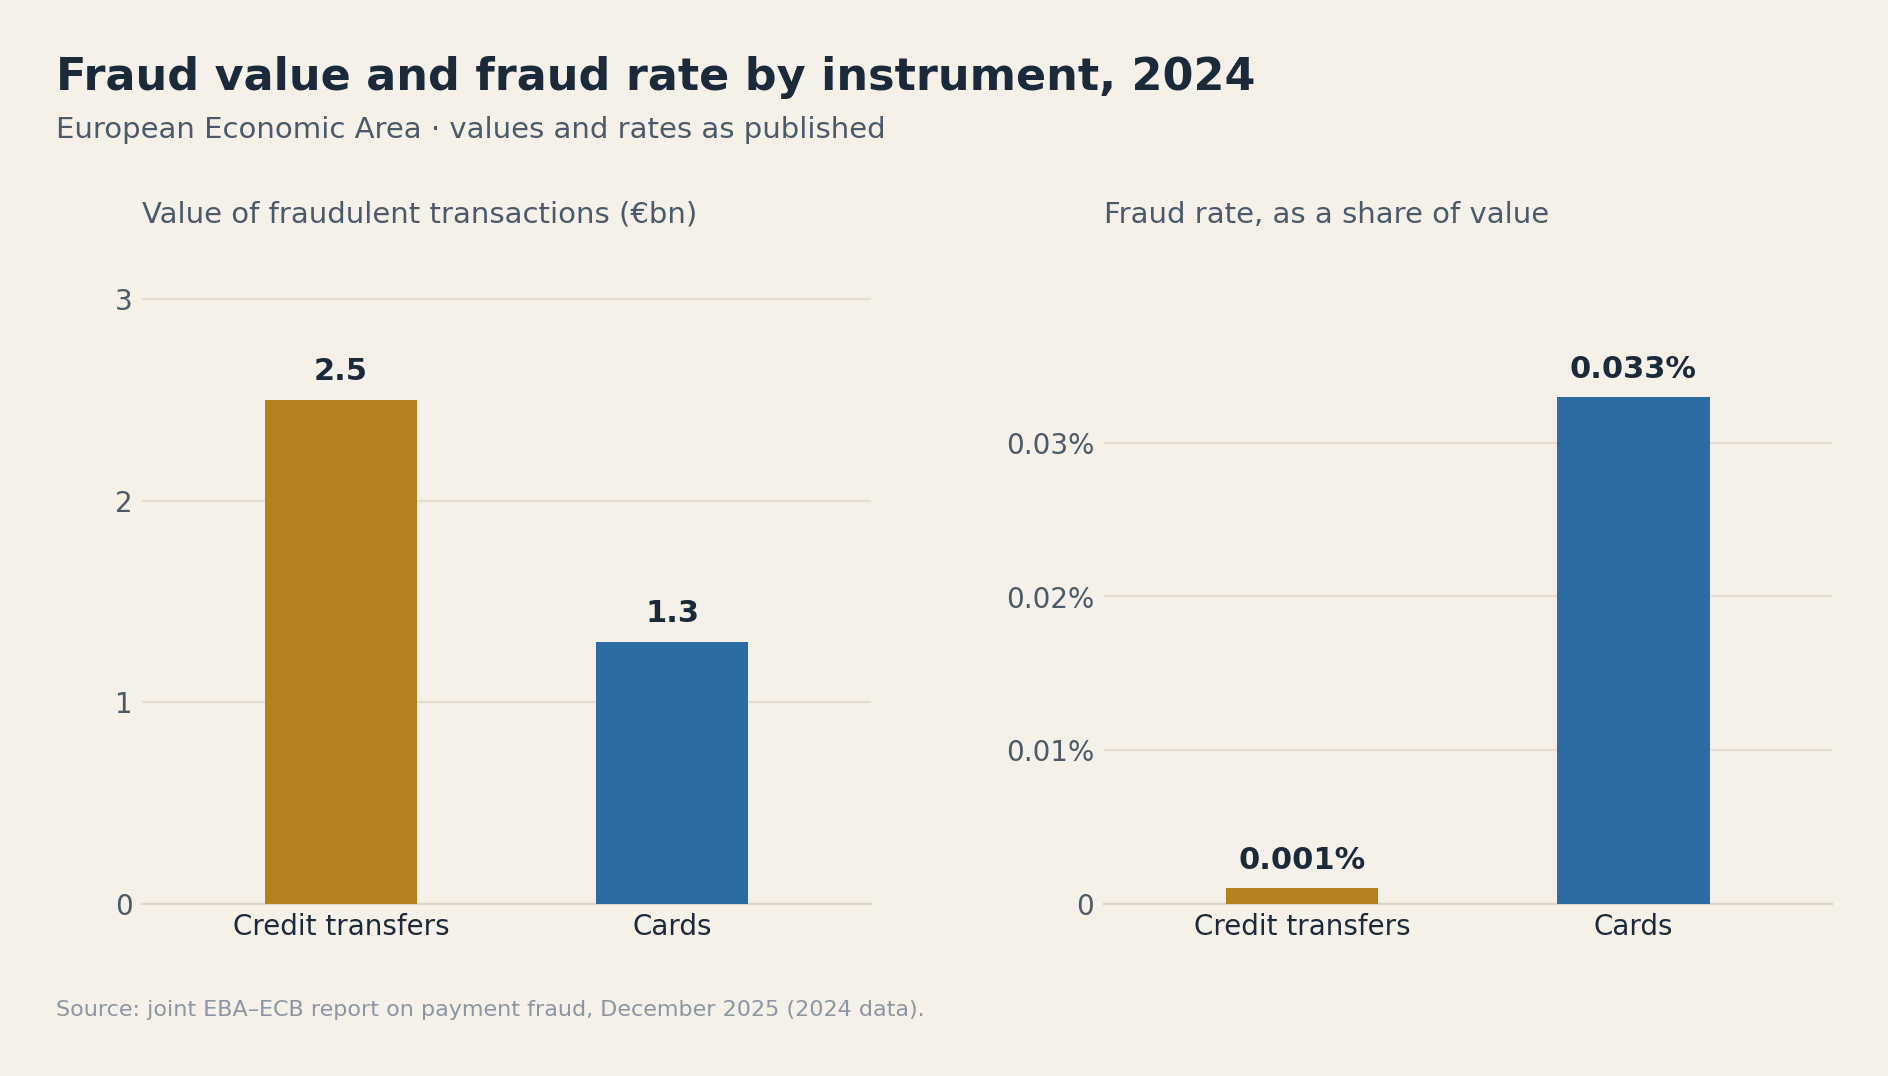
The aggregate rate, meanwhile, stays at around 0.002% of transaction value. But that rate divides fraud across all instruments by a total value that is 92% credit transfers: it is the rate of no single instrument.
Two details matter for a merchant. In absolute terms, the largest loss pool is not cards: €2.5bn on credit transfers, against €1.3bn on cards. By rate, the hierarchy inverts — 0.001% for credit transfers, 0.033% for cards, roughly thirty-three times higher. And for cards issued in the EU/EEA where the counterparty sits outside the EEA, where SCA is not required, the report measures a fraud rate about seventeen times higher by value. This is not a regulatory footnote: it is a cost differential tied to the geography of the flows and to where the acquiring is domiciled.
4. What 2026 already says, and what to build in for 2027
We should be precise here: the ECB’s payment statistics for the first half of 2026 are not published. At the observed cadence, they will appear in late January 2027. Any quantified claim about those flows today rests on something other than the half-yearly series — the February–April 2026 company survey, which measures declared acceptance and not flows; the Eurosystem payments strategy of March 2026; and the ECB’s quarterly card indicators, available on the Data Portal.
On that basis, six assumptions deserve to enter a 2027 budget exercise.
One — Do not extend the fall in the average ticket at the 2024 pace. The series indicates a stabilisation around −1% a year, not an acceleration. The prudent assumption is a near-stable ticket at aggregate level, and a trajectory of its own to be measured for low-value verticals. With inflation expected at 2.2% in 2027, a ticket stable in nominal terms falls by about two points in real terms.
Two — Audit the drift already absorbed before modelling the next one. The figure that matters is not the projection: it is the gap between your current average ticket and the one that prevailed at your last pricing negotiation. That is the only indicator that tells you whether a renegotiation is due.
Three — Budget on two drivers, not one. Payment Cost = α × Volume + β × Transactions, where α covers the components proportional to value and β the fixed per-transaction fees, before mix effects. A budget expressed as a percentage of GMV carries an error that grows every period as soon as count and value stop growing at the same pace.
Four — Separate price variance from mix variance in reporting. A higher effective rate does not prove a tariff increase. It can come from ticket, geography, card mix, channel, or instrument mix — and only then from price. Until the two are separated, the conversation with the supplier is badly framed.
Five — Treat instrument mix as the next cost driver. Mobile acceptance has doubled in two years without card or cash acceptance receding: the market is not substituting; it is stacking. Each instrument added brings its contract, its pricing schedule, its settlement cycle, its reconciliation format, its fraud profile, and its operational workload. The cost of an additional instrument is not its rate: it is its rate plus the complexity it adds to everything else. That workload appears on no invoice and sits entirely in your headcount.
Six — Adjust any annual comparison crossing 1 January 2026. Bulgaria adopted the euro on that date. Euro-area aggregates widen from H1 2026, and any 2026 growth figure quoted without a perimeter adjustment will blend organic growth with geographic extension.
What we still do not know
Europe measures its payment flows to a tenth of a point. It has no robust measure of total acceptance cost by vertical, geography and ticket size; of the genuinely fixed and genuinely ad valorem shares of the cost stack; of scheme-fee development since 2022; of the gap between contracted and realised cost; or of the full cost of a euro collected by wallet or by instant transfer, at equivalent ticket and fraud profile.
The model presented here describes a mechanism. It measures nothing, because the necessary data does not exist publicly.
Conclusion
The ECB does not measure acceptance cost. Its data nevertheless shows why that cost can drift without a supplier changing a single tariff: transaction count grows faster than value, fixed costs weigh more as the average ticket falls, and a broader mix adds complexity that a blended rate does not capture.
To prepare for 2027, the question can therefore no longer be only: how much volume will we process? It must become: how many transactions will we process, at what ticket, through which instrument, on which channel and in which geography? European aggregates cannot predict a merchant’s rate, nor support a conclusion of general cost inflation. They provide something else: a signal robust enough to stop managing payments through GMV alone. The finance work now consists of decomposing the variance before attributing it.
We are building the first European benchmark of effective acceptance cost by vertical, geography and ticket size, for publication in December. Contributions anonymised, methodology published in full alongside the results, dataset shared with contributors before release.
→ Contribute to the benchmark (5 minutes)
Sources
European Central Bank — Semi-annual payment statistics: second half of 2025, 22 July 2026; first half of 2025, 29 January 2026; second half of 2024, 23 July 2025; first half of 2024, 30 January 2025.
European Banking Authority and European Central Bank, 2025 Report on Payment Fraud, 15 December 2025. Data covering 2024.
European Commission, Directorate-General for Competition, Study on new developments in card-based payment markets, including as regards relevant aspects of the application of the Interchange Fee Regulation, final report, 6 February 2024.
European Central Bank, Use of cash by companies in the euro area in 2026, 13 August 2026; see also the ECB summary press release. Telephone survey conducted by Ipsos European Public Affairs between 23 February and 10 April 2026 among 8,205 companies across the 21 euro area countries and four business sectors.
European Union, Regulation (EU) 2024/886 on instant credit transfers in euro, 13 March 2024; timeline and key obligations presented by the ECB in Instant Payments Regulation.
European Central Bank, The ECB Survey of Professional Forecasters — Third quarter of 2026, 24 July 2026. Median inflation forecast: 2.2% in 2027.
Average ticket sizes and changes are calculated from published levels and rates, and are flagged as derived. Simulations are flagged as illustrative. Figures not verified against the primary source are explicitly flagged. No statistic is estimated or extrapolated.
The Payment Economics is an independent observatory of the economics of payments, established at the initiative of the ORYJIN team.